

Screens
A guided tour of the Modules page — what it shows, how it is laid out, and what you can do on it.
Modules
/ui/modules · System · available to every signed-in user
One glance tells you whether the agent is healthy overall: which modules are running, which are stopped, and which need attention right now — and you can act directly from here without leaving the page.
An agent is made up of many separate feature packages, from core functionality to networking, filesystem, and sensor or application modules. Not every one of them runs cleanly at all times: a module can be deliberately disabled, fail on startup, or report an error while running. This page answers the question that comes before any deeper troubleshooting: is the agent running cleanly, and if not, which module exactly is the problem? It is the natural starting point when taking over an agent, checking health after a restart, or tracing an error reported elsewhere in the interface.
Layout
Below the header sits a metrics bar, then a toolbar, and below that the module list in one of two views. Clicking a module also opens a drawer with its details.
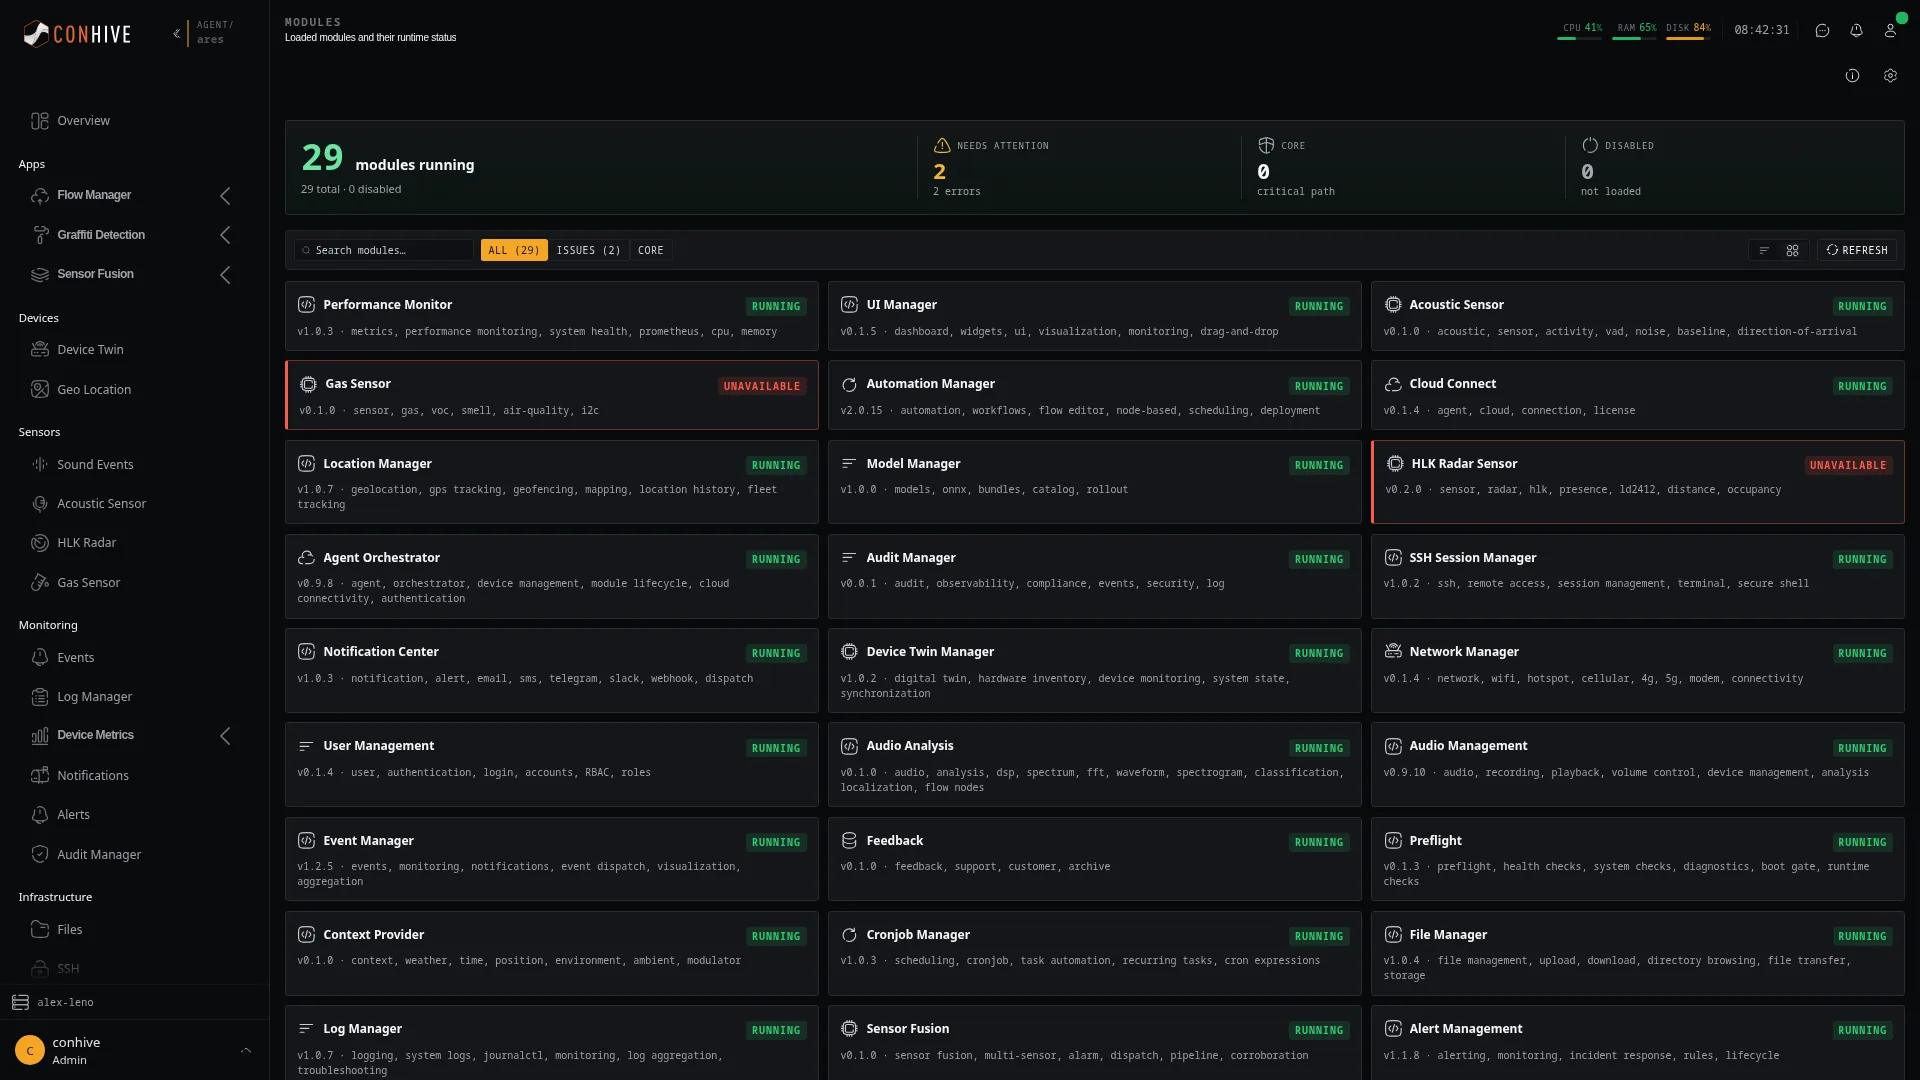
Metrics bar — four figures summarise overall state: the highlighted first metric shows how many modules are currently running, alongside the total loaded and the number deliberately disabled underneath. Needs Attention shows how many modules currently report an error, or "all clear" if none do. Core shows how many modules are marked critical to the agent's operation. Disabled shows how many modules were switched off and therefore never started.
Toolbar — a search field (Search modules…), three filter pills (All and Issues with their counts, Core without one), a switch between table and grid view, and a Refresh button that reloads the list with a visible loading state.
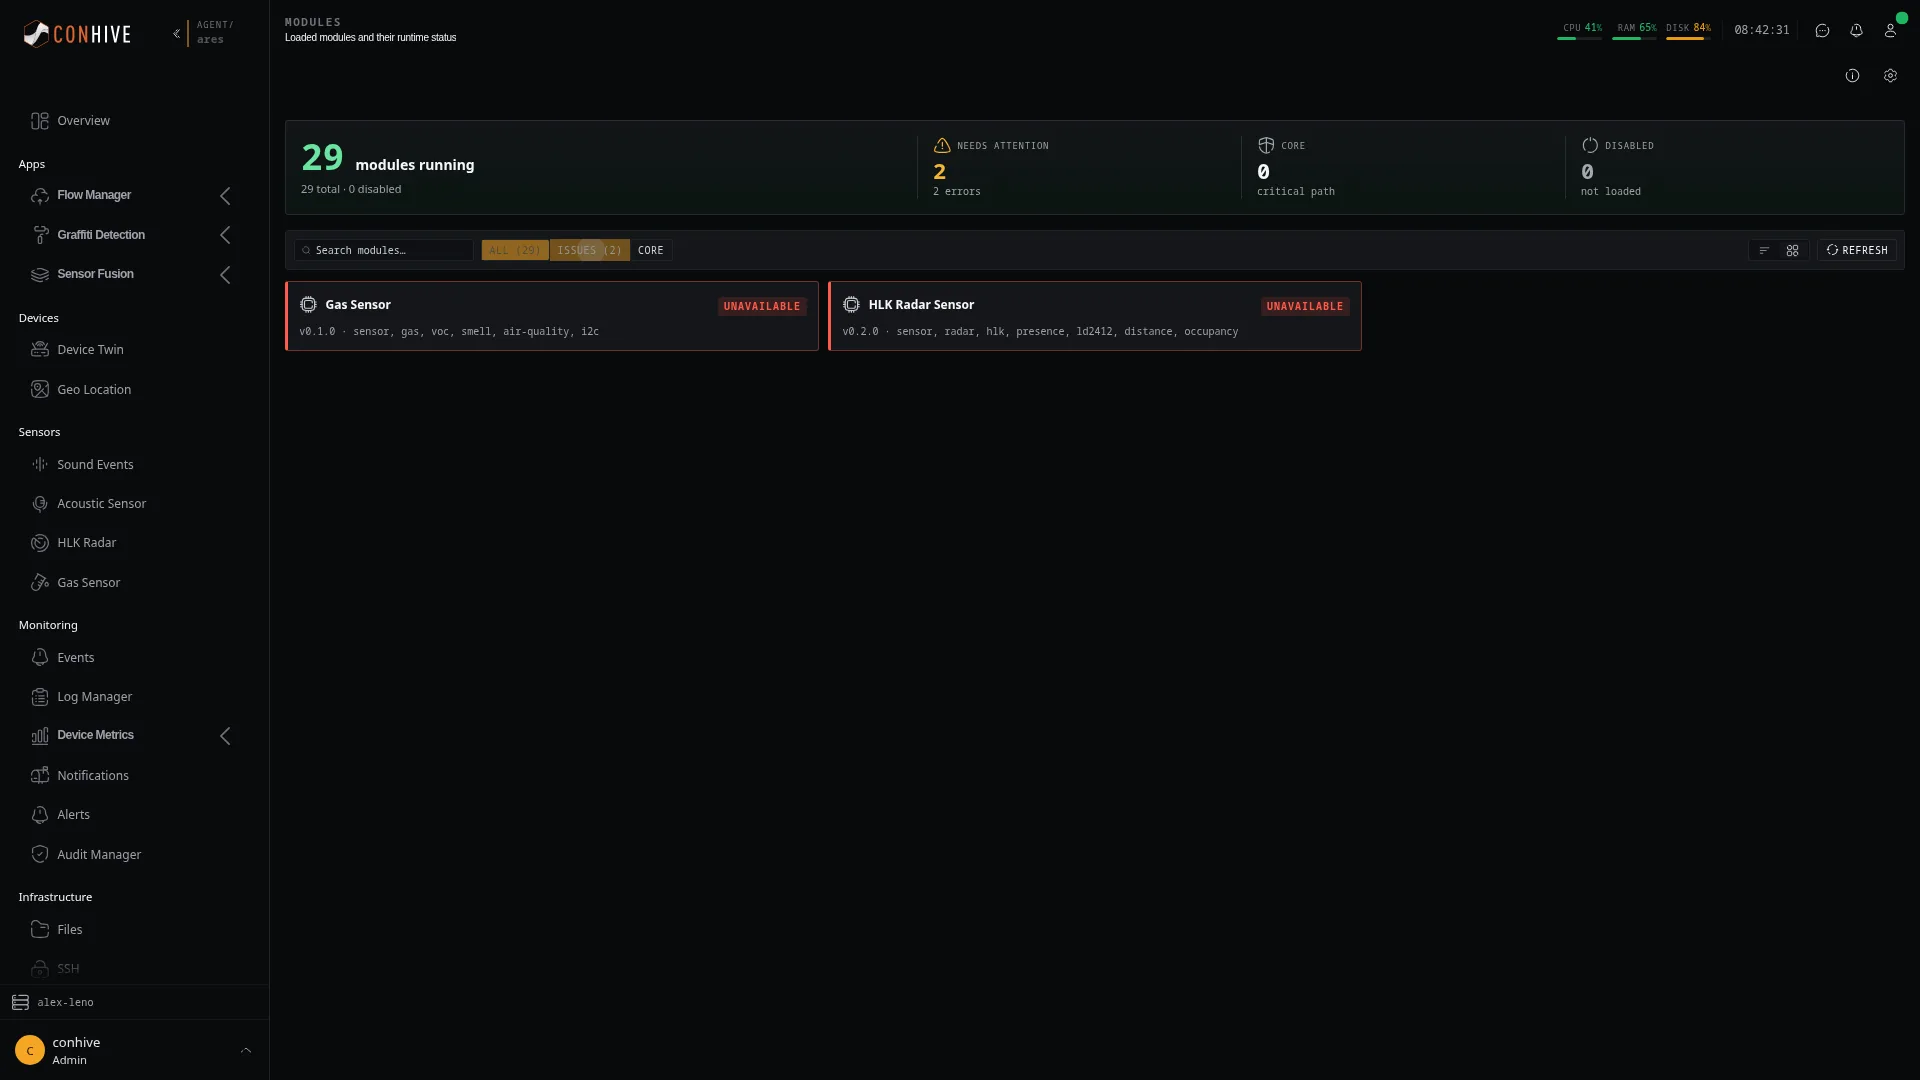
Grid view — each module is its own card: icon, name, a coloured status badge, and version and category beneath it. A card for a module with an error gets a coloured left border, more prominent if the module failed entirely, subtler for a running warning.
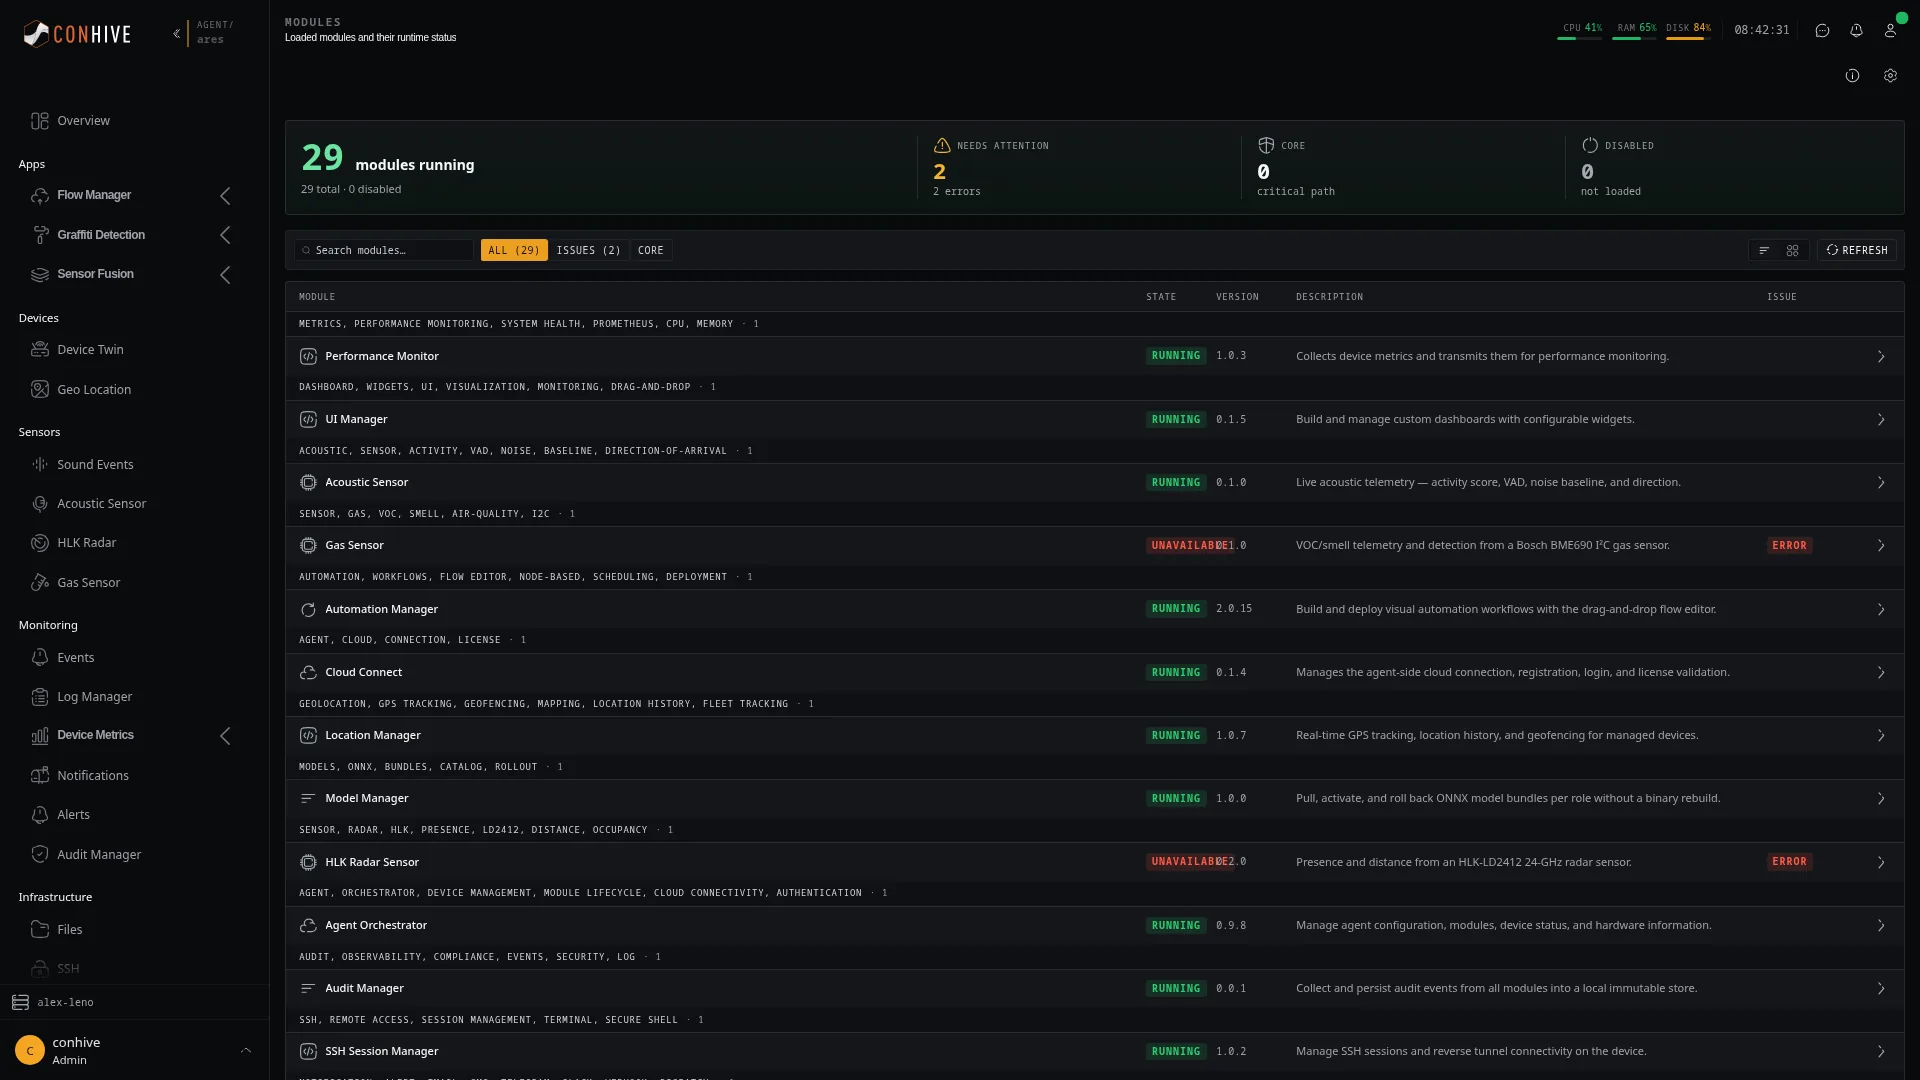
Table view — the same modules grouped by category under their own headings, with columns for name (plus a core marker for critical modules), status badge, version, description, an issue badge where relevant, and an arrow to open the details. The currently open row stays highlighted while its drawer is open.
Filtering to issues
The Issues pill narrows either view down to the modules that currently report a problem.
Switching to the table
The table view keeps the same set of modules but groups them by category, which is useful for scanning a large fleet of modules by area.
Inspecting a module
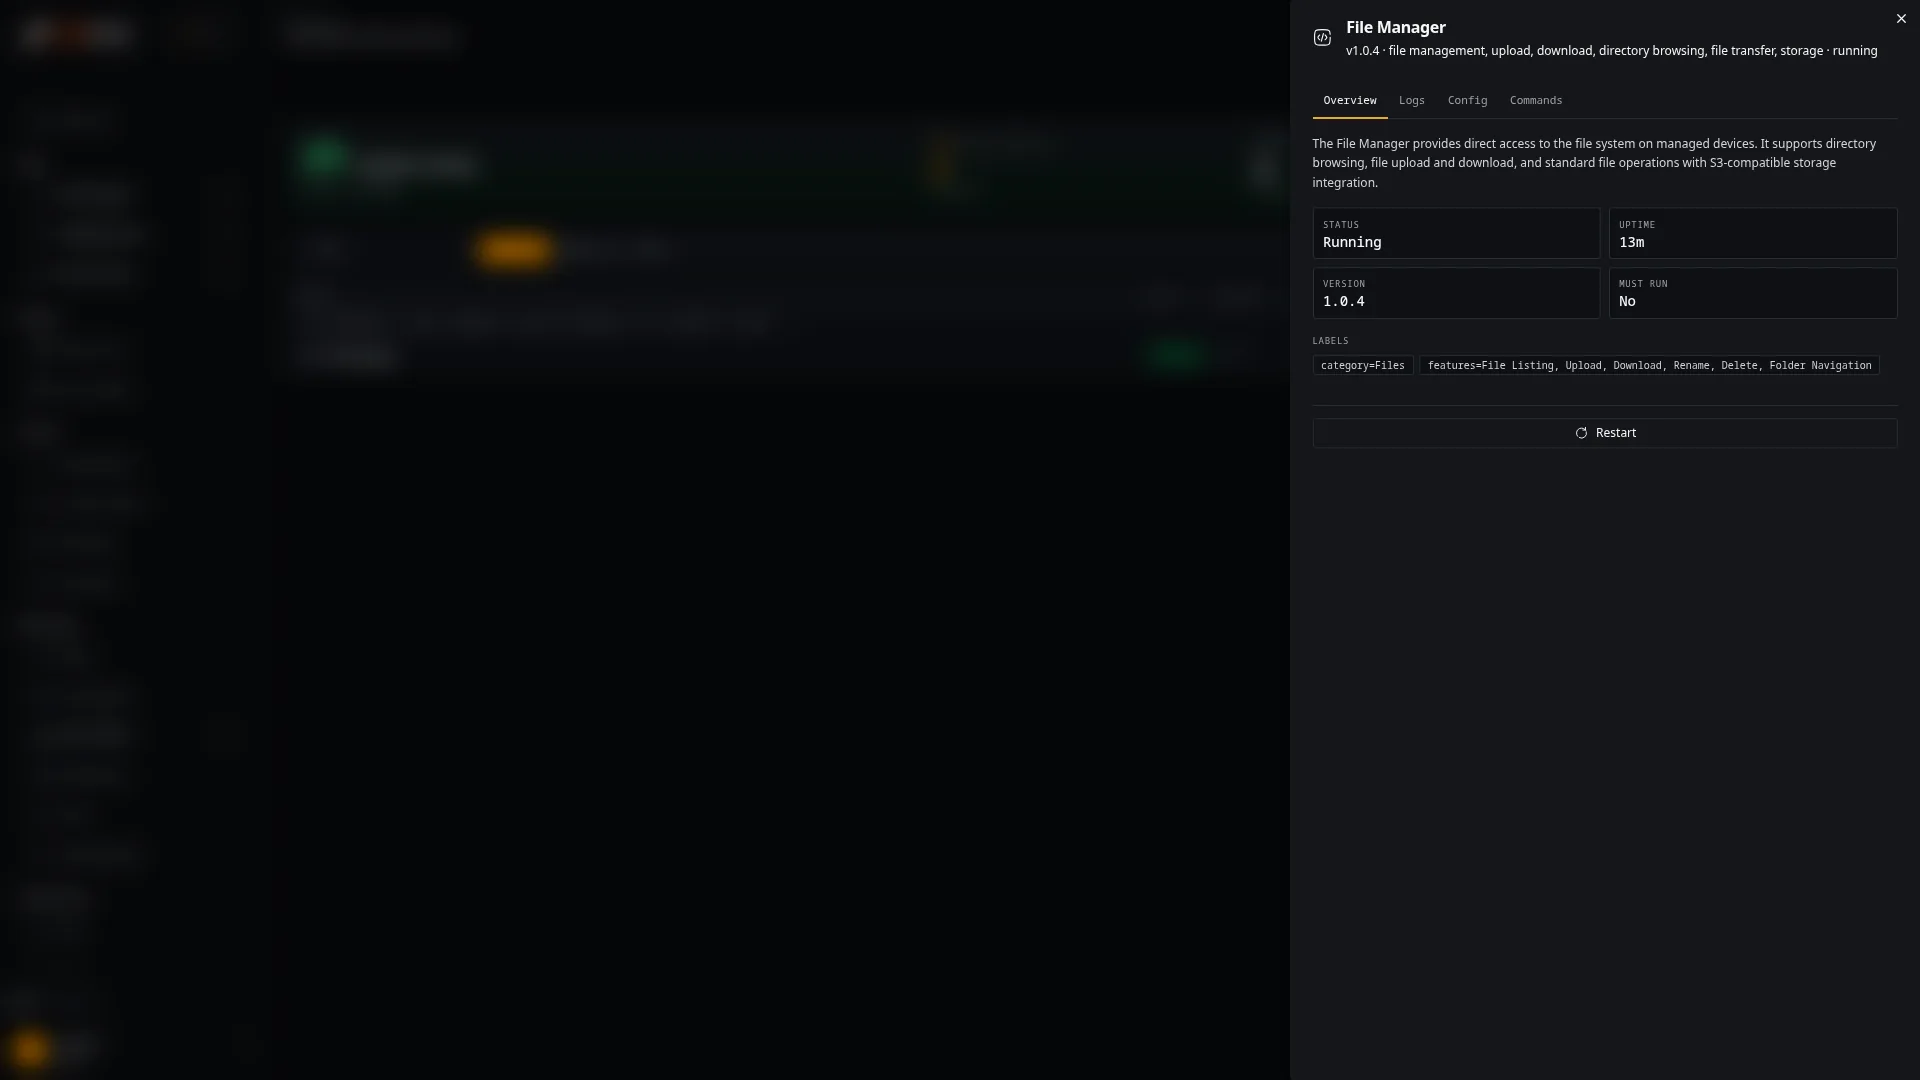
Clicking a card or a row opens a drawer with the module's name, version, category, and status in the subtitle, a core marker if it is critical, and an error block if it reports one. Below that, four tabs cover different aspects of the module.
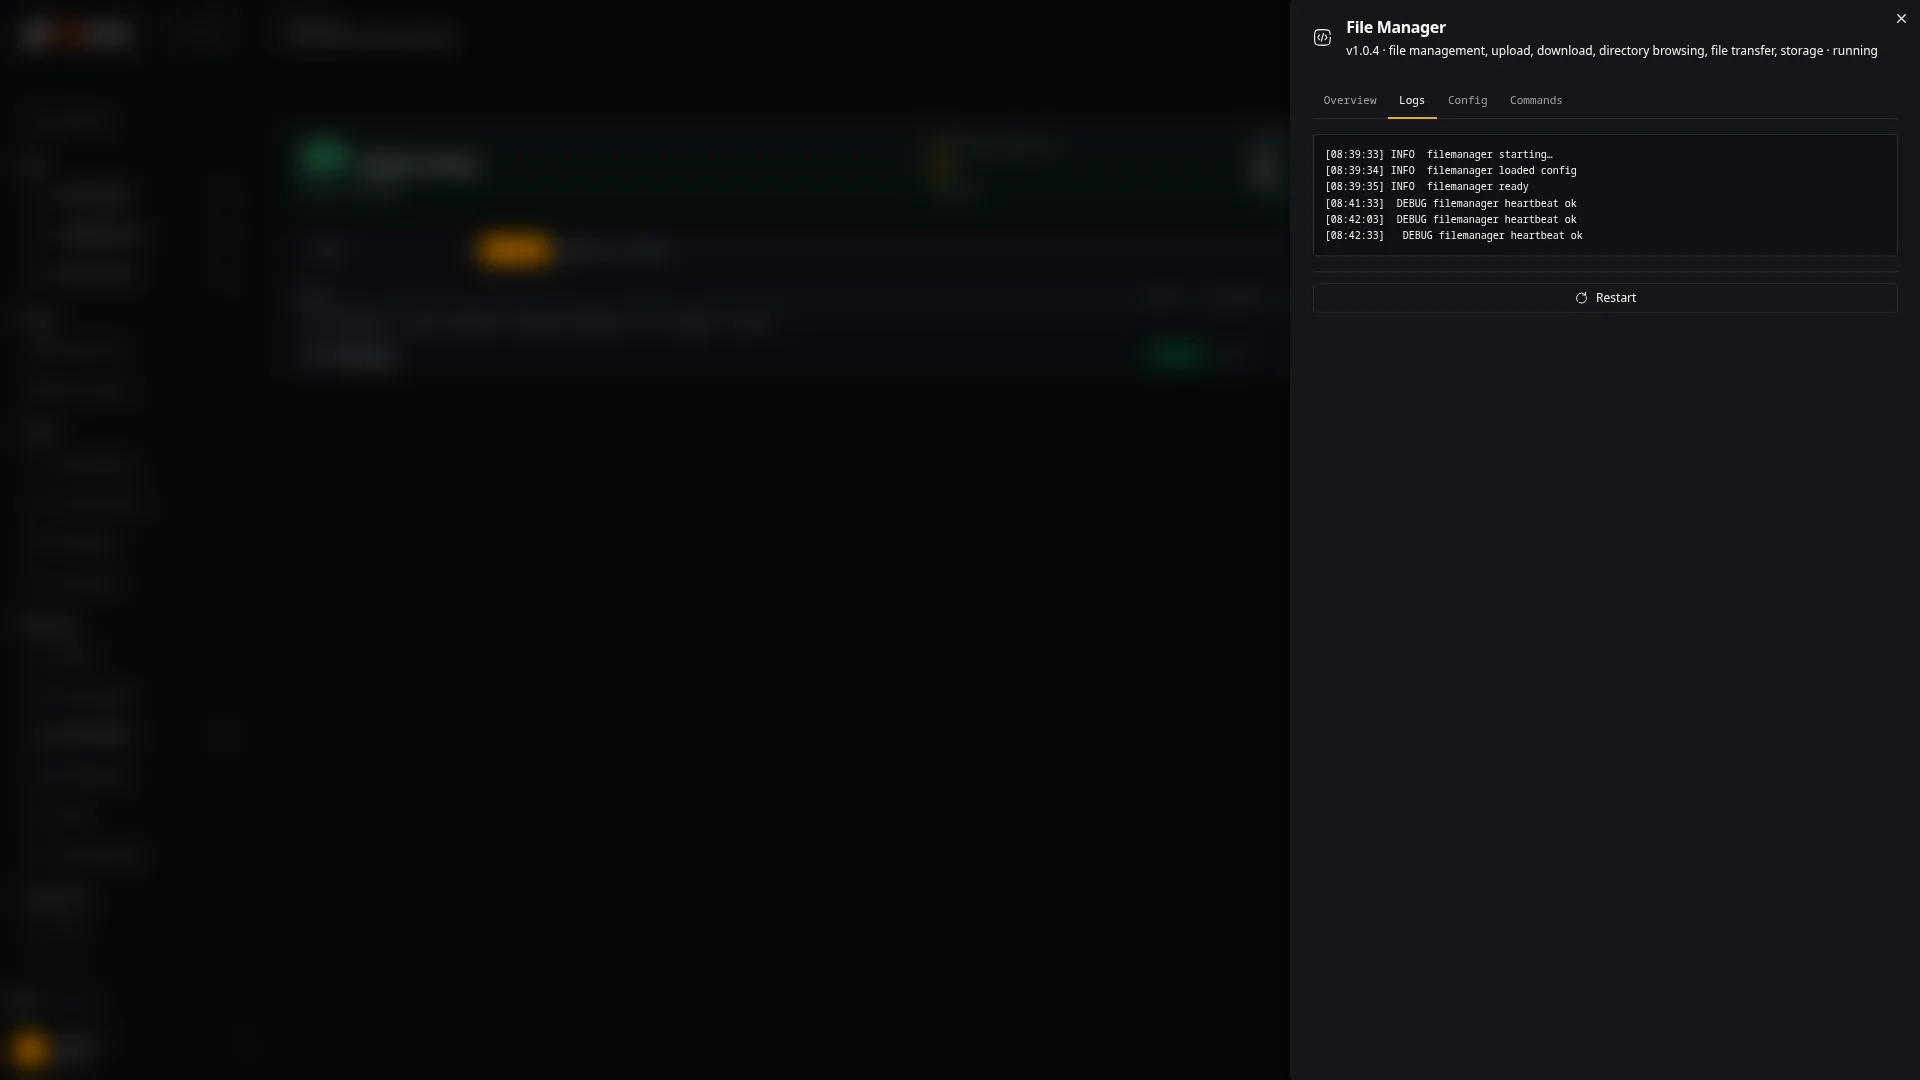
The Logs tab shows the module's most recent log lines in a console view.
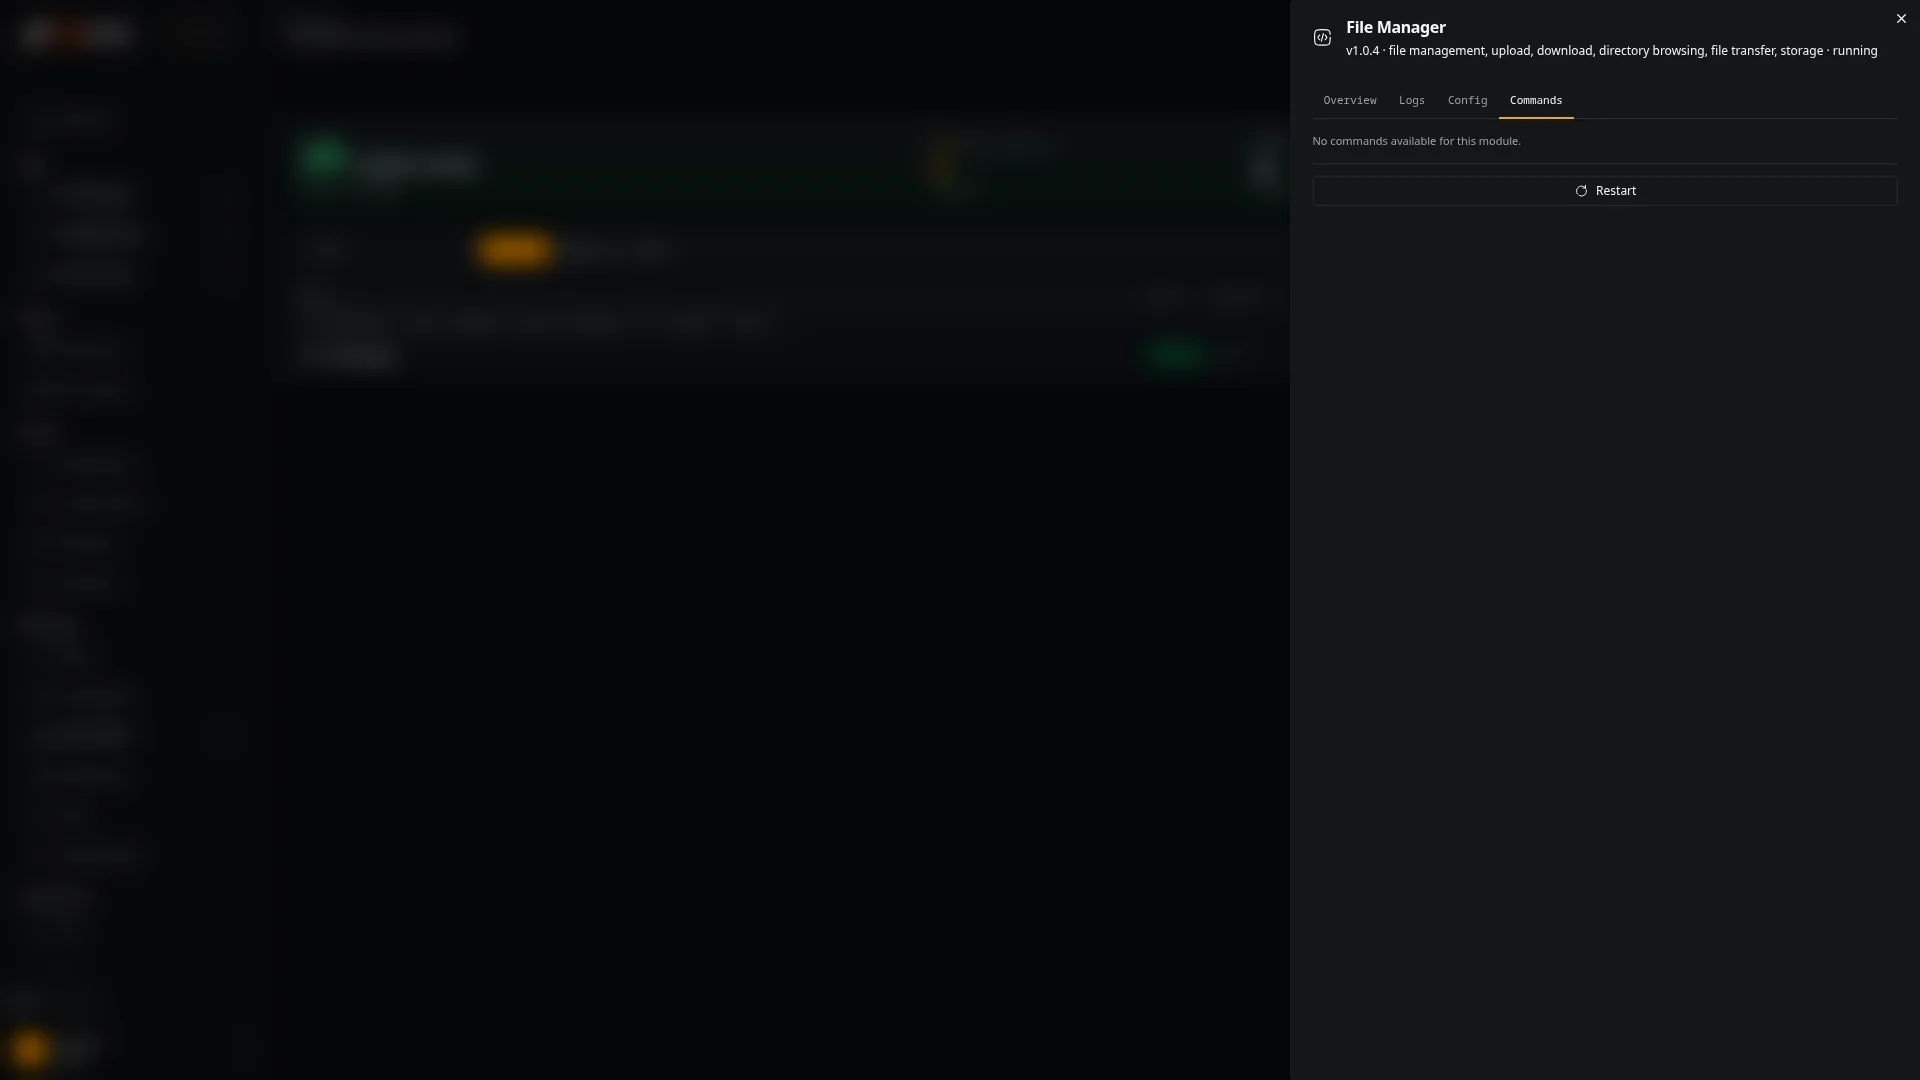
The Commands tab lists every command a module exposes, each with its own Run button.
What you can do
- Search: filter the list by module name in
Search modules…. - Filter: narrow the list to all, issue-only, or core modules via the pills — combinable with search.
- Switch views: toggle between grid and table.
- Refresh: reload the current state of every module via
Refresh. - Open details: click a card or row to open the drawer with everything known about a module.
- Switch tabs: move between
Overview,Logs,Config, andCommandsin the drawer. - Change configuration: edit a module's settings in the
Configtab. - Run a command: trigger a listed command via
Runin theCommandstab; the result is confirmed with a toast. - Restart a module: use the
Restartbutton at the bottom of the drawer; it is disabled if the module is disabled or otherwise not running.
Typical workflows
- Checking overall agent health — you open the page, glance at the metrics bar, and see immediately whether every module is running or whether
Needs Attentionshows a nonzero count. - Finding and diagnosing a failing module — you click
Issues, open the affected module from the grid or table, read the specific reasons in the drawer's error block, and switch toLogsfor the timeline. - Restarting a module after a configuration change — you find the module with search, open the drawer, adjust settings in
Config, and triggerRestartto apply the change. - Running a module command manually — you open the module, switch to
Commands, pick the command from the list, and start it withRun; a toast confirms success or failure.
States and limits
While the module list is loading, the table view shows "Loading…"; if a filter or search returns nothing, it shows "No modules". The list does not refresh itself — new data comes from Refresh, visible as a loading state on the button.
Errors are shown in the drawer at two levels: a module that failed to start entirely gets the more prominent "Module failed to start" notice, while a running module reporting an error gets the subtler "Error" notice. Both list the specific reasons where available, or the raw error message otherwise.
Restart and running a command act on a live module immediately and are confirmed by a toast. Restart stays disabled while a module is disabled or otherwise not running — nothing can be triggered on a disabled module from here. At the time these screens were taken, the Commands tab returned no commands for any module regardless of how many it actually registers; treat an empty Commands tab as a possible backend gap rather than proof a module has no commands.
The page shows and controls runtime state. Whether a module is part of the variant at all, and whether it loads automatically on the next start, is decided outside this page.
Related pages
- Overview (
/ui/overview) — the general dashboard where data from the modules listed here comes together. - Preflight (
/ui/preflight) — the agent's startup check, closely tied to the module health shown here. - Settings (
/ui/settings) — general agent settings, while module-specific configuration lives directly in this page's drawer. - Applications (
/ui/appmanager) — a related overview of installed applications in the same system area.